
Data-driven football signals, market stats, and acca selection tools.
Register for free for 7 days worth of signal data, no card required, no obligation.
Football betting data, built on models not opinions
BetSignals turns statistical models into clear, actionable signals for match winners, BTTS, Over 2.5, and accumulator tips, with full transparency on confidence and accuracy.
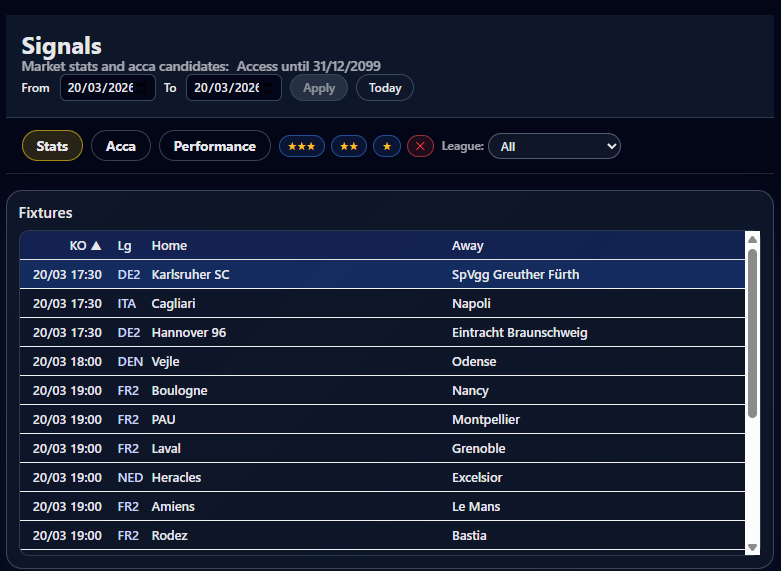
Browse fixtures across Europe
Pick any date range and see every fixture our models have signals for. Filter by league or signal strength.
- Filter by signal strength: ★★★, ★★, ★, or no signal
- Leagues across England, Spain, Germany, Italy, France and more
- Historical fixtures always free for registered users
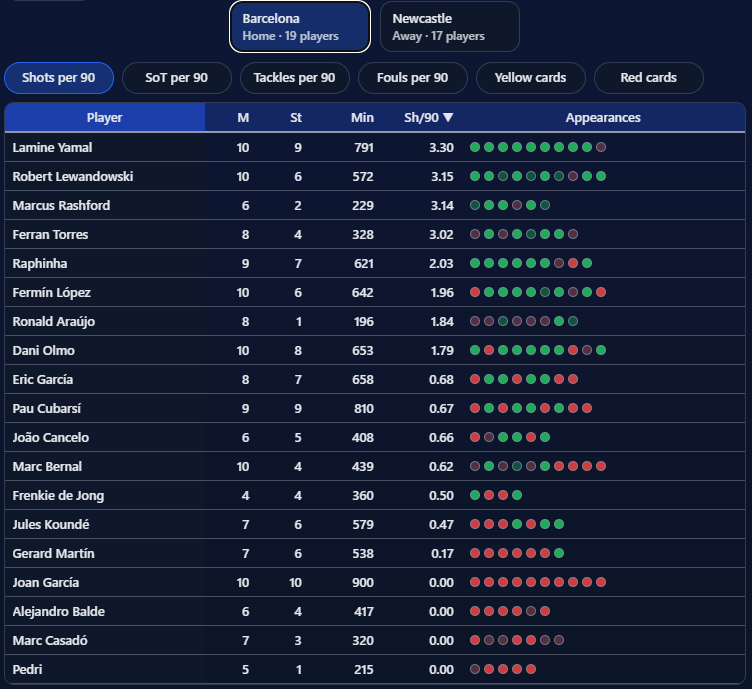
Deep player stats for every fixture
Select a fixture to see per-90-minute stats for every player in both squads.
- Shots, shots on target, tackles, fouls, cards, all per 90 minutes
- Recent appearance form for each player's last 10 games
- Switch between home and away squads instantly
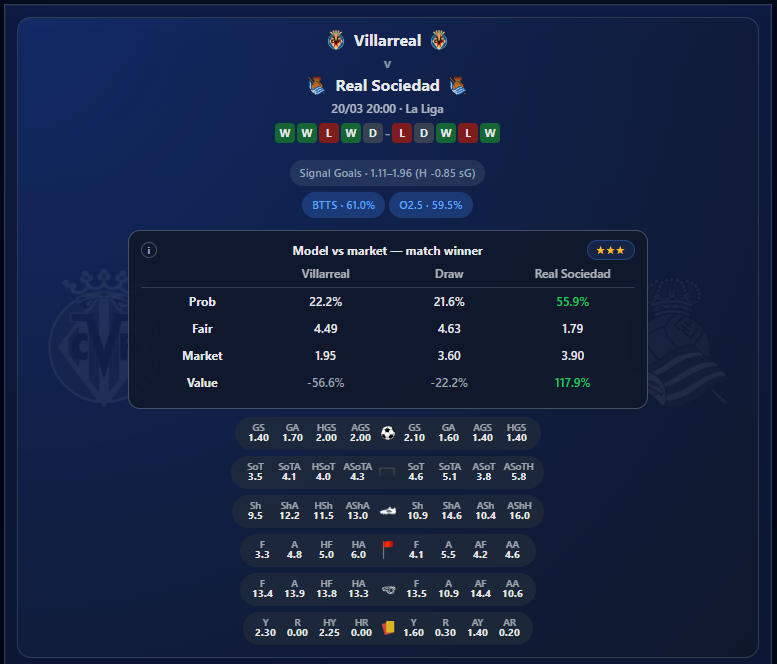
Model probabilities vs market odds
See where the model disagrees with the bookmakers. That gap is where value lives.
- Fair price from the model vs live market odds
- Value % shows how much each outcome is over or underpriced
- BTTS and Over 2.5 shown alongside the match winner signal
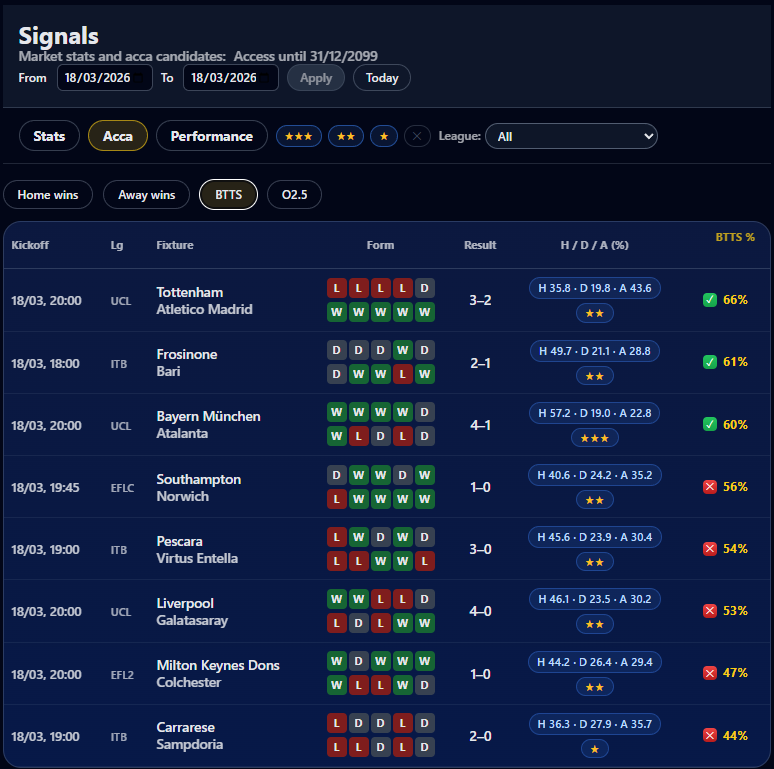
Build smarter accumulators
The Acca tab ranks every fixture by probability: Home wins, Away wins, BTTS, and Over 2.5.
- Highest-confidence bets at the top
- Recent form and H/D/A % for every fixture
- Past results shown so you can track accuracy yourself
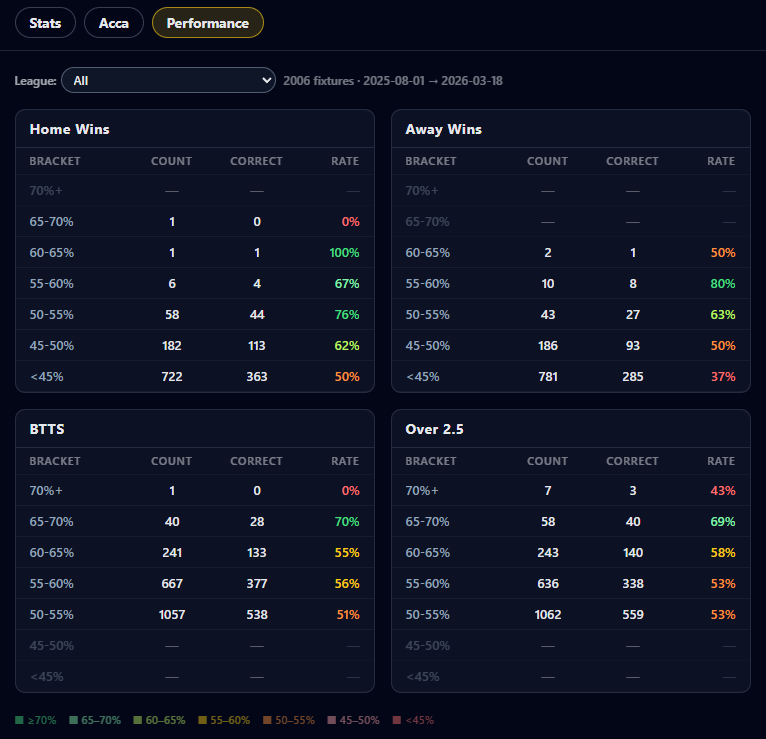
A track record you can verify
Most sites publish one headline accuracy figure. BetSignals breaks it down by confidence bracket so you can see exactly where the edge is.
- Away wins at 55-60% confidence: correct 80% of the time
- Home wins at 50-55%: 76% correct across 58 fixtures
- BTTS at 65-70%: 70% accuracy across 40 fixtures. Over 2.5 at 65-70%: 69% across 58
- Over 2,000 fixtures tracked from August 2025
Simple, transparent pricing
Create an account (no card required) and get 7 days access to upcoming fixtures.
After that, continued access costs £5 for one month.
Historical data (every past fixture and its signals) is always free for registered users.