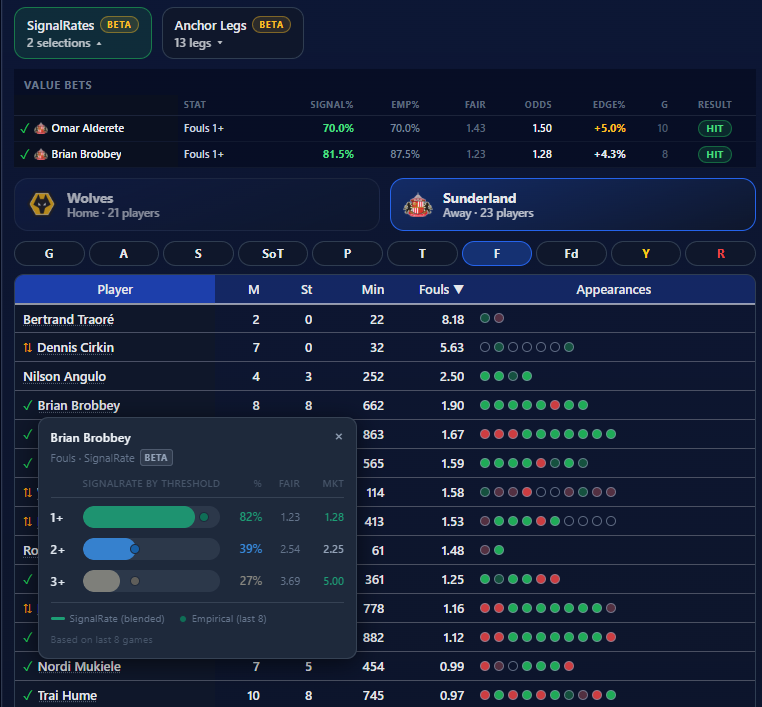
Raw player stats will mislead you if you let them. A player averaging two shots per game looks useful, until you notice half of those came against sides sitting bottom of the league. SignalRates is BetSignals' way of accounting for that context before showing you a probability.
This guide explains exactly how the calculation works.
---
The problem with raw averages
When a player takes 2.1 shots per game across ten appearances, that number tells you what happened. It does not tell you what is likely to happen on Saturday against a specific opponent.
Opposition quality varies significantly. Some sides allow high shot volumes from attackers; others defend deep and restrict attempts. A player going into a match against a high-conceding defence should have a higher expected output than their raw average alone suggests. Against a well-organised defence, the opposite applies.
SignalRates corrects for this.
---
Step 1: The player's recent history
SignalRates starts with the player's last ten appearances. For each game, it records how many times they recorded each of the following:
- Goals scored
- Assists
- Total shots
- Shots on target
- Tackles
- Fouls committed
- Fouls drawn
- Yellow cards
- Red cards
From these ten games, it calculates the player's average per game for each stat. Ten games is enough to be meaningful without over-weighting a hot or cold run.
---
Step 2: Bayesian shrinkage towards the league average
Ten games is a reasonable sample, but it is not a large one. A player who has scored in three of their last ten games might genuinely be a reliable scorer, or might have had an unusually productive spell.
To account for this, SignalRates blends the player's own average with the league average for that stat. The league average is treated as the equivalent of four additional games of evidence. So a player with ten recent appearances ends up with their average weighted against a baseline of fourteen data points (ten real, four league-average).
The effect is modest for players with consistent histories, and more pronounced for players with small samples or extreme numbers. It pulls outliers back towards what is typical for a player at that level.
---
Step 3: Opposition adjustment
For three stats (goals, total shots, and shots on target) SignalRates applies an opposition adjustment. This is where the contextual edge comes from.
The adjustment uses the upcoming opponent's average conceded rate for that stat, compared against the league average for that same stat. If an opponent concedes significantly more shots per game than the league average, players facing them get a higher adjusted rate. If they concede fewer, the rate is adjusted down.
The factor is capped at a maximum of 2.0 times the league average and a minimum of 0.5 times, to prevent extreme outliers distorting the output.
Assists, tackles, fouls, and card stats do not receive an opposition adjustment. The data linkage between those stats and specific opponent tendencies is less reliable, so they are shown based on the Bayesian-shrunk average only.
---
Step 4: The final rate
The final SignalRate for each stat is a 50/50 blend of two things:
- The empirical hit rate from the player's last ten games (how often they actually recorded that stat)
- The Poisson probability derived from the opposition-adjusted average (a statistical model of how likely the event is, given the adjusted rate)
Blending the two reduces the influence of lucky or unlucky streaks in recent form, while still anchoring the output to what has actually happened.
---
What you see on the platform
For each player, SignalRates displays three probability levels:
- r1: probability of recording at least 1 of the stat in the match
- r2: probability of recording at least 2
- r3: probability of recording at least 3
These are the numbers to use when evaluating a bet builder leg. If a bookmaker is offering 2/1 on a player having 2 or more shots on target, you can compare that implied probability against the r2 figure to assess whether the price represents value.
---
What SignalRates does not account for
SignalRates works with team-level opposition data and player-level historical appearances. It does not:
- Factor in whether a player is likely to start or their expected minutes
- Account for in-game tactical changes
- Adjust for pitch conditions, referee tendencies, or match importance
It gives you a better-informed probability than a raw average. How you layer in the context above that is still your job.
---
Next reads
- Understanding Signal Ratings: how the star rating grades value on match signals
- Player Stats: A Beginner's Guide: how to read raw player statistics before applying SignalRates
- What is a Value Bet?: how to use a SignalRate probability to assess whether a price is worth taking
---
18+ | Gambling should be enjoyable. If it stops being fun, take a break. For support and advice visit BeGambleAware.org. See our full responsible gambling guide.