So I wasn't sure if it was possible, but with the help of a bit of AI, I've managed to create a model for predicting World Cup results using Fifa's ELO model - it's not based on the Brummie band though, but I've had a go at explaining it below.
Predicting World Cup Match Outcomes: The FIFA Elo Model Explained
What is an Elo Rating?
An Elo rating is a numerical score that represents a team's playing strength. It was originally developed for chess players, but FIFA adopted it for international football teams.
Every team has a rating based on their recent match results. Win against a stronger team? Your rating goes up significantly. Lose to a weaker team? It drops. Draw against an equal opponent? Small adjustments either way. Over time, a team's rating settles around their true competitive level.
For example:
- Argentina: 1876 points — One of the world's strongest teams
- Mexico: ~1670 points — A solid, competitive team
- South Africa: ~1428 points — A capable team, but with a clear gap to Mexico
The gap between ratings tells us something crucial: Mexico is significantly stronger than South Africa.
The Mathematical Magic: Converting Ratings to Win Probability
Here's where it gets technical, but stick with me, it's good (I think!).
To calculate the probability that Mexico beats South Africa, we use a formula based on the rating difference:
Win Probability = 1 ÷ (1 + 10^(-(Mexico's Rating - South Africa's Rating) ÷ 600))
Let's break this down:
- We take the difference in ratings: ~1670 - 1428 = 242 points
- We plug this into the formula
- The result: Mexico has a 66% chance to win
Why 600 in the formula? It's a scaling factor that makes the math work nicely. Teams with a 200-point rating gap have roughly a 75% win probability, for example.
The Draw: When Teams Are Evenly Matched
The draw probability is trickier because it depends on how close the teams are:
- If Mexico and South Africa were equal in strength, the draw would be most likely (approximately 50% chance)
- The further apart they are in rating, the less likely a draw becomes
- With Mexico's 242-point advantage, a draw drops to 14%
In other words, the bigger the skill gap, the less likely the underdog holds on for a draw.
South Africa's Outside Chance
The remaining probability goes to South Africa:
- 20% chance to win
This seems small, but it's real. In football, any team can beat any other on the day. South Africa would need to play at their absolute peak while Mexico has an off day, but it happens.
From Probability to Fair Odds
Once we know these probabilities, converting to odds is straightforward:
Fair Odds = 1 ÷ Probability
So:
- Mexico 66% → 1.52 odds
- Draw 14% → 7.12 odds
- South Africa 20% → 5.00 odds
These are the "true" odds in a mathematically fair market. If you could repeatedly bet at these odds on outcomes with these probabilities, you'd break even over time.
Mexico vs South Africa: What the Market Says
But the real world doesn't work at fair odds. Bookmakers adjust their odds based on:
- How much money they expect on each outcome
- Their profit margin
- Market perception, which sometimes differs from mathematical reality
In this match, the bookmakers are offering:
- Mexico: 1.42
- Draw: 4.50
- South Africa: 7.50
Finding the Edge
Now compare what we calculated to what the market is offering:
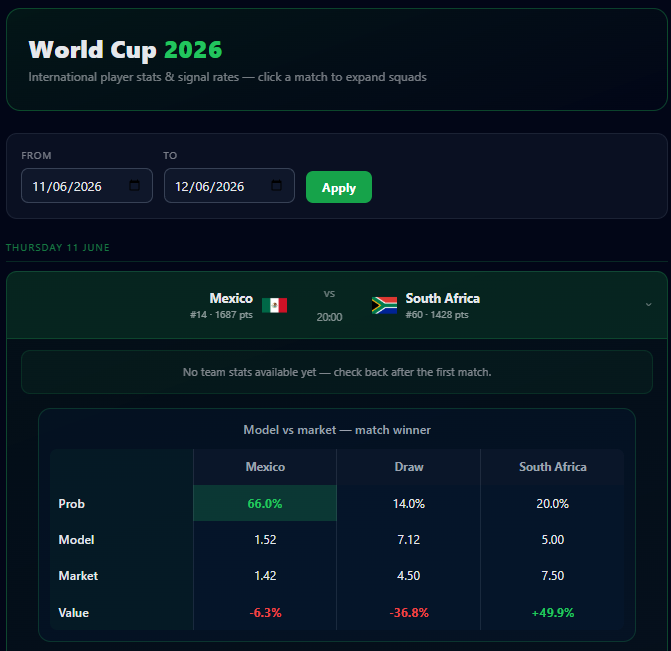
| Outcome | Fair Odds | Market Odds | Value |
|---|---|---|---|
| Mexico | 1.52 | 1.42 | -6.3% |
| Draw | 7.12 | 4.50 | -36.8% |
| South Africa | 5.00 | 7.50 | +49.9% |
Mexico at 1.42: The bookmakers trust Mexico more than our Elo model suggests. You'd get 1.42 odds on a 66% probability event, which is mathematically unfavorable.
The Draw at 4.50: The market is significantly skeptical of a draw. Even though our model says it has a 14% chance, the bookmakers are offering 4.50 odds, implying only approximately 22% probability. Big mismatch.
South Africa at 7.50: Here's the value. The market is offering 7.50 odds on what our model calculates as a 20% probability event, with fair odds at 5.00. If you believe the Elo model, and it's been proven accurate over thousands of matches, South Africa's 7.50 odds represent genuine value.
Why the Elo Model Works
The Elo model isn't perfect, but it's remarkably reliable because:
1. It's based on thousands of real match results
2. It adapts as teams improve or decline
3. It accounts for the inherent randomness in football, unlike overfitting complex models
4. It's transparent and repeatable
Of course, none of this is guaranteed, but if you're interested in using maths to help shape how you bet, this might give you a bit more data to play with.
I'll posting more about the player stats feature specifically for the World Cup too, so keep an eye out for that.